WING BEAT ROKARROWAN FALCON TRAINER AIRPLANE
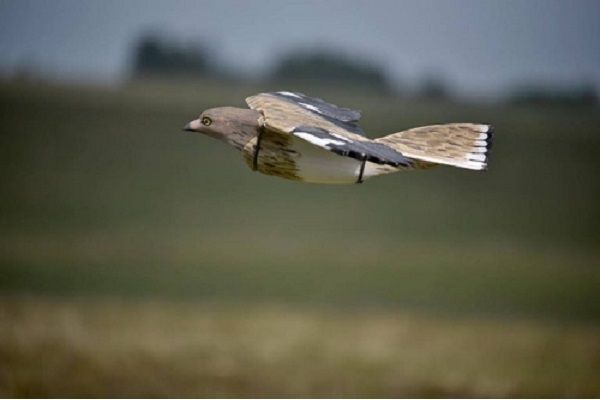
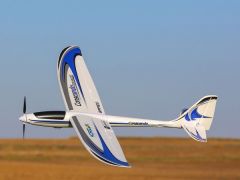
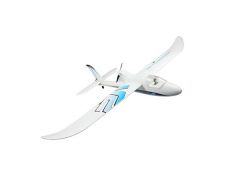
The Rokarrowan is modelled on theStone Curlew Burhinus oedicnemus, a favourite quarry of Arabian falconers. Based on the same model as the Rocrow, it has a different head and plumage pattern.
| Technical specs airbrake Rocrow: | |
| Material body fin and wing | EPP |
| Material Head | PU |
| Material Plastic parts | Nylon |
| Wingspan | 930mm |
| Length | 580mm |
| Airbrake weight | 41gr |
| AUW | 680gr +20gr for the sensors. |
| Surface Area including tail | 0.275/m2 |
| Wingloading | 0.2472 gr/m2 + 0.0073gr/dm2 for the sensors |
| Flight time | 5minutes full throttle, 10minutes half throttle |
| Max range | 1.4KM |
| Max LOS | 300Meter |
| Max climb Rate m/s | 3.9m/s |
| Sink Rate m/s | 1.45m/s |
| Max Ground/cruise Speed km/u | – |
| Min Ground Speed km/u | 41 |
| Power to weight ratio | 1:0.588 |
| Max min level Airspeed | |
| Max level acceleration 0-70km/u | – |
| Aspect ratio | 4 |
The following measurements are all done with help of a Barometric sensor that’s measuring air pressure, but also with a GPS to meassure ground speed, both sampling with a update rate of 10Hz. With graphs we are able to review the flight data to get a better understanding of the performance of the Rocrow models we are flying, which for example then can be used for a better match between the falcon and prey. The airbrake model is 35gr heavier which is something you notice most when flying slower.
The max range has been tested under a dry climate, in LOS (line of sight). We had a stable connection with no drop-outs with a fluid motion in the servo’s. We could go further (put the antenne in a awkward position but still maintained control) although 1400 meter is enough for all our flights. We didn’t measured the RSSI (Read Signal Strength indication).
Weather conditions for the flight data below has been measured in wind’s not stronger then beaufort 1, 1-5km/u or 0.3-1.5m/s.
Measurements related to surface aerea and dimensions have been taken of our 3d drawings.

Flightdata Rocrow without airbrake:
Max climb Rate m/s:
In the first graph you can see it takes around 40 seconds to climb from 30 to 170 meters, that’s 3.5 m/s. In the second graph you can see the climb rate already set out against the altitude, which is also maxing out at roughly 3.5 m/s.

Sink Rate m/s:
85 meters in 62.5 seconds= 1.36m/s
Interesting is the fact that with tailwind or headwind doesn’t affect the sink rate.

Min Ground/cruise Speed km/u:
Here you can see the Barometric altitude against the GPS speed in the same graph. Instead of counting and take a average of each data point you can see 2 blue lines represent the maximum and minimum ground speed. The Pink represent the average ground speed of 36 km/u.

Max Ground Speed km/u:
Max ground speed has been measured with a headwind and a tail wind. As mentioned before, wind conditions where below Beaufort 1. Altitude in red, has been set against the GPS speed. Because the launch is included you can see it takes almost 10 seconds to get to the maximum speed, but eventually maxes out at 85 km/u. With the tailwind it’s maxing out at 97.5 km/u which averages out at 91.5 km/u max ground speed.

Power to weight ratio:
In this case we messure power as thrust. The model is on a weighing scale and giving full throttle is showing a thrust of 400 gr. This on 16.4V. The all up weight of the model 640gr:400gr thrust=0.625 or 1:0.625. This basically means we can’t do vertical climbs which has been covered at the maximum climb rate graph.
Max level acceleration 0-80km/u:
8.7 seconds in headwind:

Since the speed did not exceed 80 km/u we’ve taken the amount of time for 40 km/u and doubled it.
2.75sec.2=5.5 seconds. Which averages the acceleration speed at 0-80 km/u in 7.1sec:

Flightdata Rocrow with airbrake:
The airbrake is adding 35 gr to the model. Let’s find out how and if it’s affecting the performance in any way.
Max climb Rate m/s:
In the first graph you can see the average climb-rate is roughly 3m/s. it takes around 37 seconds to climb from 30 to 170 meters, that’s roughly 3.78 m/s. Interesting, since the airbrake weight should decrease the climb-rate. Let’s do this again, but now over a longer period of time, see second graph. It takes 53.5 seconds to climb from 14 to 205 meters, that’s 3.57 m/s. In the second graph you can see the climb rate already set out against the altitude, which is roughly maxing out at 3 m/s.


Sink Rate m/s:
The sink rate is measured starting from a altitude of 98 meters, decreasing to an altitude of 35 meters where it takes 65 seconds. The sink rate over this period of time is 1.45 m/s.

Min Ground/cruise Speed km/u:
Here you can see the Barometric altitude against the GPS speed in the same graph. Instead of counting and take a average of each data-point you can see 2 blue lines represent the maximum and minimum ground speed. The Pink represent the average ground speed of 41 km/u.

Max Ground Speed km/u:
Graph comes shortly.
Power to weight ratio:
In this case we measure power as thrust. The model is on a weighing scale and giving full throttle is showing a thrust of 400 gr. This on 16.4V. The all op weight of the model 400gr:680gr =0.588 or 1:0.588. This basically means we can’t do vertical climbs which has been covered at the maximum climb-rate graph.
Max level acceleration 0-70km/u:
| Manufacturer | dji |
|---|

